
Day trading is fast, demanding and unforgiving. It is not based on long-term fundamentals or holding through every pullback because a company has a good story. It is based on short-term price movement, execution quality, timing and risk control. The trader is trying to capture intraday moves before the setup fails, liquidity changes or volatility turns against the position.
That is where indicators come in. A good indicator helps organise market information. It can show momentum, trend direction, volatility, average price, relative strength or the level of participation behind a move. A poor indicator setup does the opposite. It crowds the chart, creates conflicting signals and gives the trader enough excuses to enter late, exit early or do nothing while pretending to analyse.
The problem is not that traders lack indicators. The problem is that they often use too many. Most trading platforms offer dozens of technical tools, and it is easy to keep adding them until the chart looks like a weather radar having a bad week. More indicators do not mean better decisions. They usually mean more noise.
The most useful day trading indicators are simple, widely watched and tied to real market behaviour. Volume shows participation. VWAP shows the day’s average traded price adjusted for volume. RSI measures recent price pressure. Moving averages show trend and pullback structure. MACD tracks momentum shifts. ATR measures volatility. The economic calendar helps traders avoid being blindsided by scheduled news.
None of these tools should be treated as a signal machine. Indicators do not make money. Decisions do. Indicators are there to support price action, not replace it. A trader still needs a setup, a defined entry, a stop, a target, position sizing and a reason to stay out when conditions are poor.
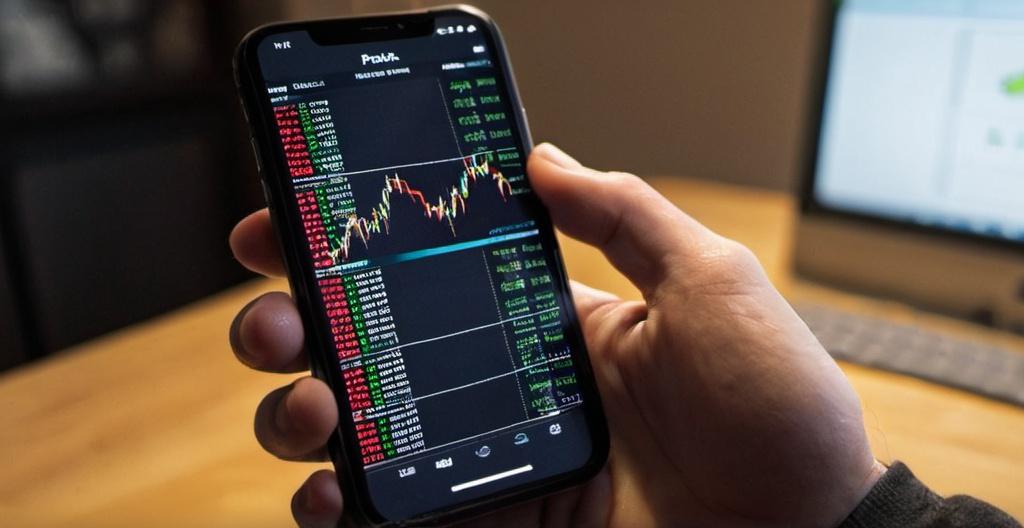
How Day Traders Should Use Indicators
Indicators should help a trader answer a narrow question. Is the market trending or ranging? Is volume supporting the move? Is price stretched from its average? Is volatility high enough to justify the trade? Is there a scheduled event that could distort the setup? These are practical questions. If an indicator does not help answer one of them, it is probably chart decoration.
Day traders should avoid treating any indicator as a standalone entry signal. A moving average crossover does not automatically mean buy. RSI above 70 does not automatically mean short. Price above VWAP does not automatically mean the trend will continue. These readings only matter in context. The same signal can mean different things in a strong trend, a choppy range, a news-driven move or a low-volume session.
The best use of indicators is confirmation. Price action usually comes first. A trader might identify a breakout, pullback, rejection or range shift on the chart. Indicators then help judge whether the trade has enough support. Volume can confirm participation. VWAP can show whether buyers or sellers control the session. ATR can help set a stop that is not laughably tight. RSI and MACD can show whether momentum is improving or fading.
Indicators also help traders avoid weak conditions. This matters more than many beginners think. A good day trader is not only looking for trades. They are also looking for reasons not to trade. Low volume, flat moving averages, narrow ATR and a major data release due in ten minutes are all reasons to slow down. Not every chart deserves attention. Some charts are just expensive wallpaper.
The goal is to build a small group of tools that complement each other. A trader does not need five momentum indicators saying the same thing in different colours. One trend tool, one volume tool, one momentum tool and one volatility reference is usually enough. The rest comes from price, risk management and execution.
Volume
Volume is one of the most important indicators for day trading because it shows participation. Price movement without volume can be fragile. A breakout on low volume may fail because not enough buyers or sellers are supporting the move. A move on strong volume deserves more attention because it shows that market participants are active at that price level.
Volume is often used to confirm breakouts. If a stock has been capped at resistance and then breaks above that level with a clear increase in volume, the move has more credibility. The trader can see that the breakout is not just a thin push through a quiet order book. It has participation behind it. That does not guarantee follow-through, but it improves the quality of the signal.
Volume is also useful during pullbacks. In a strong intraday uptrend, a pullback on lower volume may suggest profit-taking rather than aggressive selling. If price then resumes upward on higher volume, the trend may still have support. On the other hand, a pullback that begins with heavy selling volume can signal a shift in control. The same price move means more when volume shows urgency.
Volume can also expose weak trades. If price is grinding higher but volume keeps fading, the move may be losing energy. This does not mean the trader should instantly short it. It means the trader should be careful about chasing. Late entries into low-volume moves are where traders often buy the top and then blame the chart, the broker, the moon and anything else within reach.
Relative volume can be more useful than raw volume. A stock trading one million shares may be active or quiet depending on its usual behaviour. Relative volume compares current activity with normal activity for that instrument. High relative volume can signal that the stock is in play, often due to news, earnings, sector movement or unusual institutional interest. Day traders often prefer instruments with strong relative volume because they tend to offer cleaner movement and tighter execution.
Volume should still be read with caution. A large volume spike can mark the start of a move, but it can also mark exhaustion. A heavy volume candle into resistance may show aggressive buying, or it may show late buyers being absorbed by sellers. Context decides the interpretation. Volume tells the trader that something is happening. Price structure tells them what that something may mean.
VWAP
VWAP stands for volume weighted average price. It shows the average price an asset has traded at during the session, weighted by volume. This makes it more useful than a simple intraday average because it gives more importance to prices where more trading has occurred. For day traders, VWAP is one of the most watched intraday reference levels.
VWAP is useful because it reflects the session’s fair price in a practical sense. If price is trading above VWAP, buyers have generally been willing to pay above the day’s volume-weighted average. This can support a bullish intraday bias. If price is below VWAP, sellers may be in control, or buyers may be unwilling to support prices above the average. This can support a bearish intraday bias.
Many institutional traders also monitor VWAP because it is used as an execution benchmark. A fund buying shares may want an average price close to or better than VWAP. This makes the level relevant beyond retail chart watching. When many participants observe the same level, it can become an area where price reacts, pauses or consolidates.
Day traders use VWAP in several ways. In a trend day, price may hold above VWAP and use it as dynamic support. Pullbacks toward VWAP can create trade opportunities if volume, price action and broader market direction support the move. In a bearish session, price may remain below VWAP and reject attempts to reclaim it. That can help traders avoid fighting the intraday trend.
VWAP is also useful for spotting overextension. If price moves far away from VWAP very quickly, the trade may become stretched. That does not mean reversal is guaranteed. Strong stocks can stay extended longer than short sellers stay comfortable. But the distance from VWAP helps the trader judge whether a new entry is late. Buying far above VWAP after several strong candles often leaves little room for error.
The mistake is treating VWAP as a magic line. Price does not have to bounce at VWAP. It can slice through it, hover around it or ignore it during news-driven moves. VWAP works best when combined with volume, trend structure and market context. If price reclaims VWAP with rising volume after a failed breakdown, that can mean something. If price drifts around VWAP all morning in weak volume, the signal is probably mud.
Relative Strength Index
The Relative Strength Index, or RSI, is a momentum oscillator that measures the speed and size of recent price changes. It is shown as a value between 0 and 100. Traditional settings often treat readings above 70 as overbought and readings below 30 as oversold. That basic interpretation is widely known, but it is also widely misused.
For day trading, RSI should not be treated as a simple reversal button. A stock with RSI above 70 can keep rising if momentum remains strong. A stock with RSI below 30 can keep falling if sellers remain in control. Markets can stay overbought or oversold for longer than expected during strong intraday moves. Shorting only because RSI is high is a quick way to learn humility, usually at market price.
RSI is more useful as a momentum filter. If price is breaking above resistance and RSI is rising from the middle of its range, momentum may be improving without being excessively stretched. If price is making a new high but RSI is failing to confirm, the trader may be seeing momentum divergence. That can warn that the move is weakening, especially if volume also fades.
RSI can also help traders avoid poor entries. If price has already moved sharply and RSI is near an extreme, the trade may be late. That does not mean the move will reverse, but it may mean the risk-to-reward has deteriorated. A pullback or consolidation may provide a better entry than chasing the final candle of a move that everyone else already noticed.
Timeframe matters with RSI. A reading on a one-minute chart can change quickly and may produce many false signals. A five-minute or fifteen-minute RSI may provide cleaner information for many day traders, especially when combined with support, resistance and VWAP. The lower the timeframe, the more noise the trader has to tolerate.
RSI works best when it supports a broader setup. A bullish setup might include price above VWAP, rising volume, higher lows and RSI holding above the midpoint rather than repeatedly collapsing. A bearish setup might show price below VWAP, weak bounces and RSI failing to regain strength. The RSI reading is not the trade. It is one piece of the read.
Moving Averages
Moving averages smooth price data and help traders see trend direction more clearly. Day traders often use short-term exponential moving averages, such as the 9 EMA and 20 EMA, because they respond quickly to price movement. Some also use a 50-period simple moving average as a broader intraday reference. The exact settings matter less than using them consistently and understanding what they show.
A rising short-term moving average can show intraday strength. If price is holding above the 9 EMA or 20 EMA during a strong move, buyers are controlling the rhythm. Pullbacks toward these averages may offer entries if price holds, volume supports the move and the broader market is aligned. This is common in momentum trading, where traders look for controlled pullbacks rather than random entries.
Moving averages also help identify trend damage. If price has been riding above the 9 EMA and then breaks below the 20 EMA on rising volume, momentum may be weakening. That does not always mean the trend is over, but it tells the trader conditions have changed. Staying in a trade after the original structure has broken is not discipline. It is stubbornness with a stop loss problem.
The 50 SMA can act as a broader intraday reference. Some traders use it to judge whether a stock is maintaining a larger short-term trend. If price is above rising short-term averages and above the 50 SMA, the trend may be cleaner. If price is chopping back and forth through the 50 SMA, the market may be range-bound and less suitable for trend strategies.
Moving averages are less useful in choppy markets. When price moves sideways, moving averages flatten and cross repeatedly. This can create false signals. A trader using moving average crossovers in a range may end up buying every small push and selling every small dip, which is a generous donation to transaction costs.
Moving averages should therefore be used to define structure, not predict the future. They show what price has been doing. They do not know what the next candle will do. Their value comes from helping traders identify trend, pullback zones and areas where momentum may be changing. Price action and volume still need to confirm the setup.
MACD
MACD stands for Moving Average Convergence Divergence. It is a momentum indicator based on the relationship between moving averages. The standard version uses the difference between a short-term exponential moving average and a longer-term exponential moving average, with a signal line plotted alongside it. The histogram shows the gap between the MACD line and the signal line.
MACD is mainly used to identify trend momentum and shifts in momentum. When the MACD line crosses above the signal line, traders may read it as improving bullish momentum. When it crosses below the signal line, they may read it as weakening or bearish momentum. The histogram can also show whether momentum is expanding or contracting.
For day traders, MACD can be useful when the market is trending. It can help confirm that momentum is building behind a move or warn that momentum is fading before price fully rolls over. It is often more useful on slightly higher intraday timeframes, such as five-minute, fifteen-minute or thirty-minute charts, because very low timeframes can produce too many crossovers.
The limitation is that MACD is a lagging tool. It is based on moving averages, so it reacts after price has already moved. This means a crossover may arrive late, especially during fast intraday moves. A trader who enters only after a delayed MACD signal may end up buying after the clean part of the move has already happened.
MACD also performs poorly in sideways conditions. When price is range-bound, the indicator can produce repeated crossovers that lead nowhere. This is why MACD should be used with trend structure, VWAP, volume and support or resistance. If price is breaking out with volume and MACD confirms momentum expansion, that is more useful than a random crossover inside a flat range.
The best role for MACD is confirmation, not command. It can tip the balance when the price setup is already clear. It should not be the only reason to enter a trade. If the chart does not make sense without MACD, the trade probably does not make sense with it either.
Average True Range
Average True Range, or ATR, measures volatility. It does not tell the trader whether price will rise or fall. It tells the trader how much the instrument has been moving over a selected period. For day traders, this is useful because volatility affects stop placement, target setting and position sizing.
A stock with a high ATR can move quickly and require wider stops. A stock with a low ATR may not offer enough movement to justify the trade after spreads, commissions and slippage. This is why ATR is often used before entering a trade, not after. It helps answer whether the instrument has enough room to move for the strategy being used.
ATR is especially useful for setting realistic stops. Placing a tight stop on a highly volatile instrument is a common error. If a stock regularly moves one dollar in a short period, a ten-cent stop may be hit by normal noise. The trader then gets stopped out, watches the trade work later and calls it bad luck. It was not bad luck. It was a stop placed without respect for volatility.
ATR can also help set targets. If an instrument has already moved far beyond its usual intraday range, the trader should be cautious about expecting another large move without fresh volume or news. If the instrument has barely moved and volume is increasing, there may be more room. ATR does not predict the move, but it gives a reference for what is normal and what is stretched.
Position sizing can also be linked to ATR. A wider stop requires smaller size if the trader wants to keep the same risk per trade. This is basic risk management, but many traders ignore it. They use the same share size on every setup even when volatility changes. That means risk changes without permission. The market loves that kind of carelessness. It gets paid from it.
ATR should not be confused with opportunity. High volatility creates movement, but it also creates danger. A stock moving wildly can produce large gains and large losses. ATR helps the trader understand the size of the battlefield. It does not tell them whether the battle is worth joining.
Economic Calendar
The economic calendar is not a technical indicator, but day traders should treat it as part of the same toolkit. Scheduled events can change volatility, spreads and liquidity within seconds. A clean technical setup can fail instantly when inflation data, employment figures, central bank decisions or unexpected policy comments hit the market.
For equity traders, major economic releases can affect index direction, sector strength and market risk appetite. A stock may have a perfect intraday pattern, but if the broader market moves sharply after a Federal Reserve announcement or CPI release, the individual setup may become irrelevant. Market-wide events can overpower stock-specific technicals.
For forex traders, the economic calendar matters even more. Currency pairs react directly to interest rate expectations, inflation reports, employment data, growth figures and central bank communication. A trader holding a position into a major release may face spread widening, slippage or a rapid move through a stop level. That may be acceptable for a news trading strategy, but it should never be accidental.
The economic calendar also helps traders decide when not to trade. Staying flat before a major release is not cowardice. It is risk control. Some traders prefer to wait until the first move passes and then trade the reaction once spreads normalise and direction becomes clearer. Others avoid the session entirely if the event risk is too high. Both approaches are better than being surprised by a scheduled event that was public all week.
Earnings calendars matter for stock day traders as well. Individual stocks can gap sharply after earnings, guidance updates or analyst calls. A stock with earnings due after the close may trade differently during the session as participants position ahead of the release. A stock that reported before the open may have high volume and strong movement, but also wider spreads and less predictable reactions.
The rule is simple. Technical indicators work inside a market context. News can change that context quickly. A trader who ignores the calendar is not being technical. They are being uninformed with extra candles.
Combining Indicators Without Cluttering the Chart
The strongest day trading setups usually combine price action with a small number of indicators that answer different questions. A useful setup does not need six oscillators, three moving average ribbons and a chart background that looks like a nightclub floor. It needs structure, confirmation and risk control.
A clean momentum setup might begin with price breaking above a clear resistance level. Volume increases during the breakout, showing participation. Price is above VWAP, supporting a bullish intraday bias. Short-term moving averages are rising, showing trend structure. RSI is strong but not wildly extended. ATR shows that the instrument has enough volatility to reach a reasonable target. The economic calendar shows no major release due in the next few minutes.
That type of setup does not guarantee a winning trade. Nothing does. It simply means the trader has several forms of confirmation pointing in the same direction. The trade still needs a defined entry, stop and target. It also needs position sizing that keeps the loss manageable if the breakout fails. Good confirmation does not justify oversized risk.
A clean reversal setup might look different. Price pushes far away from VWAP after a sharp move. Volume spikes into a known resistance or support level. RSI shows divergence, with price making a new extreme while momentum fails to confirm. MACD momentum begins to weaken. ATR shows the instrument is already stretched relative to its usual movement. The trader then waits for price action to confirm the turn, rather than entering only because an indicator looks tired.
The difference between confirmation and clutter is purpose. Volume answers whether traders are participating. VWAP answers where price is relative to the session’s volume-weighted average. Moving averages answer trend structure. RSI and MACD answer momentum. ATR answers volatility. The calendar answers event risk. If two tools answer the same question, one may be enough.
Traders should also avoid changing indicators after every losing trade. A loss does not automatically mean the tool failed. It may mean the setup was poor, the market changed, the entry was late or the position was too large. Constantly replacing indicators prevents the trader from learning how any of them behave. The goal is not to find the perfect indicator. The goal is to build a repeatable process.
Backtesting and journaling help here. A trader should record which indicators were used, what the setup looked like, whether the entry followed the plan and whether the exit was disciplined. Over time, the trader can see which tools improve decision-making and which ones create hesitation. The chart should earn every indicator it displays.
It is also worth separating indicators by market type. Trend-following indicators work better in trending sessions. Mean-reversion tools work better in range-bound or stretched conditions. Volume and VWAP are broadly useful, but even they need context. A trader who uses the same signal in every environment will eventually discover that the market has more moods than the setup has answers.
Risk Management Still Comes First
Indicators are useful, but risk management decides whether a trader survives. A high-quality setup can still fail. A strong breakout can reverse. A clean VWAP reclaim can turn into a trap. An RSI divergence can appear too early. ATR can expand suddenly. News can hit without warning. Day trading involves uncertainty, and no indicator removes it.
A trader should know the maximum risk before entering. That means knowing the stop level, position size and expected loss if the trade fails. The stop should be based on the setup and volatility, not on how much loss feels emotionally comfortable after the trade is already open. Once the position is live, emotions become very persuasive. They are also terrible accountants.
Position sizing should adjust to volatility. If ATR is high and the stop needs to be wider, size should usually be smaller. If volatility is low and the stop is tighter, size may be adjusted, but only within the trader’s risk rules. The point is to keep risk consistent across different market conditions. A trader who uses the same size on every trade may be taking very different risk without noticing.
Risk also includes trade frequency. Overtrading is one of the fastest ways to turn decent analysis into poor performance. Each trade carries spread, commission, slippage and emotional cost. A trader who takes every small signal eventually stops selecting trades and starts reacting to movement. That is not day trading. That is clicking with confidence.
The best indicator setup is the one that helps the trader act less, not more. It filters poor conditions, confirms better setups and keeps attention on risk. If an indicator encourages constant action, it is probably hurting more than helping.
For more tools, real-time strategy breakdowns, and updated market information, DayTrading.com has practical resources worth bookmarking.
This article was last updated on: July 2, 2026