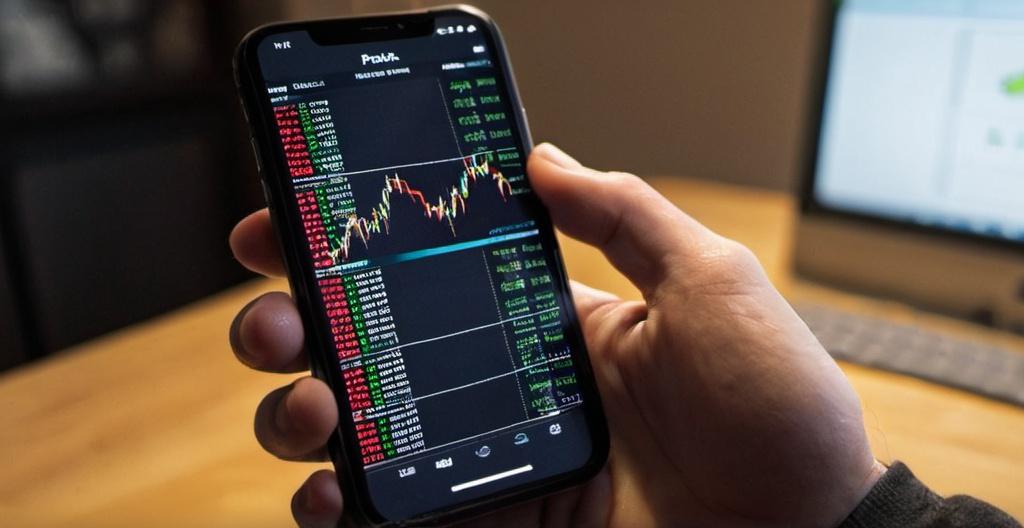
Day trading is fast, aggressive, and unforgiving. It’s not about long-term fundamentals or “holding for the dip”—it’s about acting on sharp, quick price movements and squeezing profit out of them before the market changes direction. And in that game, financial indicators are your toolkit. Use the right ones, and you can spot momentum, time your entries, and avoid messy setups. Use the wrong ones—or worse, all of them at once—and you end up paralyzed or overtrading.
So which indicators actually matter for day traders? Here’s a breakdown of the ones that consistently help—if you know how to read them.

1. Volume
If price is the headline, volume is the fine print. It tells you whether a move is worth paying attention to. Strong breakouts on weak volume usually fail. But when you see a stock break through resistance with a volume spike? That’s a sign traders are backing the move.
Volume confirms conviction. If you’re day trading without checking volume, you’re guessing.
2. VWAP (Volume Weighted Average Price)
VWAP is one of the most-used tools by professional day traders. It shows the average price a stock has traded at throughout the day, weighted by volume.
Why does it matter? It acts as a kind of magnet—prices often revert to it, bounce off it, or consolidate around it. Many traders use VWAP as dynamic support/resistance or to judge whether a stock is overextended.
Above VWAP = bullish bias.
Below VWAP = bearish bias.
3. Relative Strength Index (RSI)
RSI measures how fast and how far price has moved recently. It gives a number between 0 and 100—anything above 70 is considered overbought, below 30 is oversold.
For day traders, RSI isn’t a magic entry signal, but it’s a useful filter. If you see a stock running up with an RSI near 80, don’t assume it’s going to crash—but know that momentum could stall. It’s most useful when combined with price action and volume.
4. Moving Averages (EMA 9, EMA 20, SMA 50)
Moving averages help smooth out price and highlight trend direction. In day trading, short-term EMAs like the 9 and 20 are particularly useful for spotting momentum and pullback zones.
Price riding above the 9 EMA? You’ve got strength. Price crossing below the 20 EMA with volume? Momentum could be fading.
The 50 SMA can act as a line in the sand—especially for swing-minded day traders watching multiple timeframes.
5. MACD (Moving Average Convergence Divergence)
MACD is great for tracking trend direction and spotting momentum shifts. When the MACD line crosses the signal line, it suggests a change in momentum. Combined with other signals—like price breaking a support level—it can give early warnings before big moves.
Don’t use it in isolation, but as part of a setup, it can tip the scales.
6. ATR (Average True Range)
This one doesn’t tell you direction—it tells you volatility. ATR shows how much a stock typically moves in a given timeframe. If the ATR is high, you can expect bigger price swings. If it’s low, don’t expect much action.
ATR is critical for setting realistic stop-loss and take-profit levels. No point placing a 10-cent stop on a stock that regularly moves $2 per candle.
7. Economic Calendar (Yes, Seriously)
Even if you’re only trading technicals, you need to know when key news is dropping. Economic indicators like Fed rate decisions, CPI, NFP, and GDP releases can cause massive volatility—even in stocks that seem unrelated.
It’s basic: don’t be in a trade five minutes before major news hits. Set alerts, be aware, and adjust your positions accordingly.
Putting It All Together
Here’s the real key—don’t stack every indicator on your chart at once. That’s how you end up second-guessing every decision. Choose 2–3 that complement your strategy, learn how they behave, and use them to confirm what price action is already telling you.
A clean setup might look like:
- Stock above VWAP and EMAs
- RSI rising but not overbought
- Breakout happening on rising volume
- ATR showing room to move
- No major news in the next 30 minutes
You don’t need a degree in math—you just need context and discipline.
For more tools, real-time strategy breakdowns, and updated market info, DayTrading.com has practical resources worth bookmarking.
Final Thought
Indicators don’t make you money—decisions do. Use indicators to read momentum, confirm setups, and manage risk. Not to chase every blip on the chart. Day trading is already fast. Your indicators should simplify things, not clutter them.
Keep it clean. React with reason, not emotion. And remember—every great trade starts with a clear read, not a flashy signal.
This article was last updated on: July 8, 2025
